
Fact check: ABS lies to hide the scale of excess deaths
Fact check: ABS lies to hide the scale of excess deaths

In the death statistics of 2022/2023, the ABS excluded the 2020 deaths, because it is lower than other years and makes 2022 look even worse.
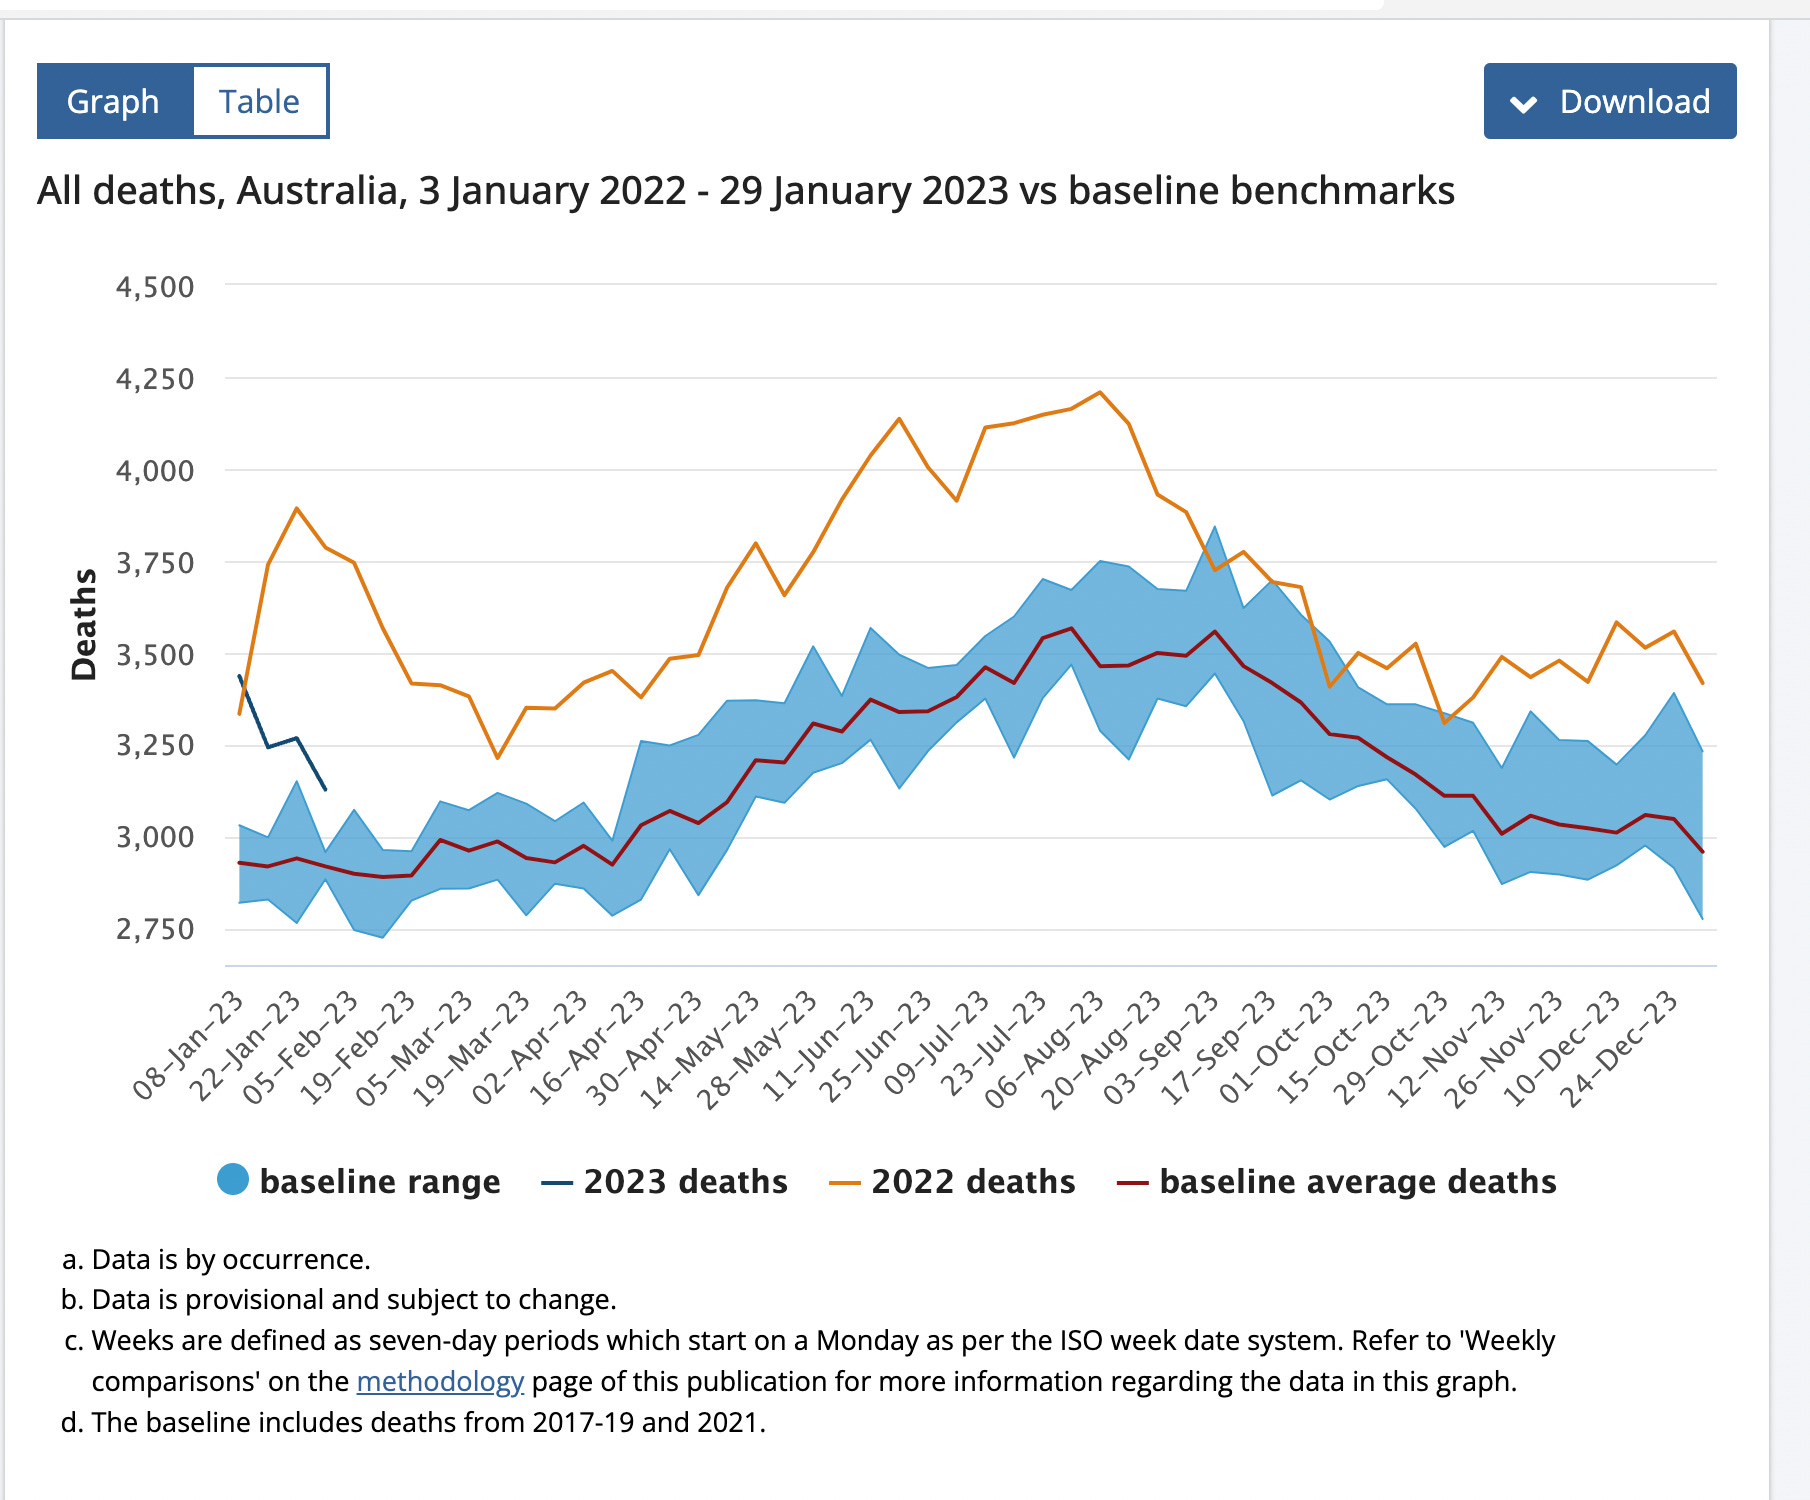
Look at point “d” at the bottom of the graph:
I plan on writing more on this when I have time. Arkmedic’s blog goes into the details, and you can read about it here:
I went to their data to try to reproduce the effect Arkmedic is talking about.
Something really weird: the averages of 2015-2021 have changed.
Here it is below. The average of 2015-2019 plus 2021 from the provisional mortality data (orange line) is different in the November release - actually higher - - than the same average in the March data release - that’s the green line. What is going on?
You would expect the 2022 data to change. Not the historical data.
What I’m wondering is - did they originally make the historical data higher, to try to hide the 2022 disaster, but then changed it back when they released the actual figures?

This is the webpage for the December release:
This is the data for the November/December release:
This is the most recent webpage: