Edited 1 March 2023.
There is a great deal of evidence now that the Covid vaccines cause miscarriages and menstrual irregularities in women, and that they knew this when they authorised the vaccines for Emergency Use.
I am only looking at some of the data here.
The first part of this article comes from my article https://firstfactcheck.substack.com/p/covid-vaccines-cause-miscarriages-973 in which I am basically going through the data referenced in this excellent article of Ah Khan Syed’s, which you should read:
The Historical Control Group
Ah Khan Syed looked into the TGA Pfizer document release for TGA approval of the Pfizer experimental injection and found evidence that they were definitely massaging the data to make it look good.
Here is the TGA document referenced in this article, the Nonclinical Evaluation Report BNT162b2 [mRNA] COVID-19 vaccine (COMIRNATY™) Submission No: PM-2020-05461-1-2 Sponsor: Pfizer Australia Pty Ltd January 2021.
The laughable methodology they use in this study is to compare the BNT162b2 group not to the control group in the study, but to another mythical entity called the “historical control group.”
This would probably be because BNT162b2 don’t look too good at all if you compare it to the actual control group in the study.
What the “historical control group" is, is a bunch of rats from other studies. It doesn’t actually tell us if they were the control group rats in the other studies, or the rats that were given other poisonous medications. My guess is, both. I could be wrong. But the study doesn’t seem to specify, unless I missed it.
But before we look at that, we need to look at the Doctors for Covid Ethics FOI request.
The FOI request
In February 2021, Doctors for Covid Ethics made a FOI request to the Australian drugs regulator, the TGA, asking three questions about the TGA approval of the Pfizer injectable products:
Did the TGA request the raw data from Pfizer.
Did any of the committees approving the vaccine look at the raw data and/or discuss it
What were the “studies” referred to in the approval document relating to teratogenicity (risk of harm to a fetus)
The TGA replied initially that such a request was too voluminous.
After a bit more prodding, they sent a letter agreeing to provide ‘documents’ that contained the following startling admissions:
After this the TGA requested an extension of time; because obviously providing the one document was an extraordinarily difficult and onerous task that was taxing their resources to the limit, given the voluminous nature of the data requested.
The voluminous nature of this request as it turned comprised a single document, with the full contents and 7 additional pages of actual content - pp 8-13 & p 38 - of a 1145 page study into the effects of the vaccines on Wistar rats. About half the pages provided were largely redacted, like this:
Maybe they were really big pages, and to lift them up and put them into the A0.5 photocopier meant they had to hire a forklift, and all the forklift drivers were busy or off with Covid or something. I can’t really think of any other reason that it took them five months to find one document.
These studies found no fertility effects apparently, which is quite startling considering the rest of this tawdry tale.
Part 2: The real documents released.
On July 15th 2021, the documents relating to the evaluation of the Pfizer COVID-19 vaccine were released. Document 6 is rather interesting in a number of ways.
Firstly, funnily enough, someone left “show corrections” on when they made the pdf. Note below, they changed the Pregnancy Category from “B2 - should only be considered when the potential benefits outweigh any potential risks for the mother and fetus” to “B1 - no embryofetal effects have been noted - vaccine is safe for pregnant women.”
In the section below (Page 15) is where the “Show Changes” was still enabled and it still says in one place “should only be considered when the potential benefits outweigh any potential risks for the mother and fetus”
But as you’ll see below this wasn’t supposed to be the final draft of this section, if you look at the extract below on Page 5, all doubts removed:
And this was actually a complete lie.
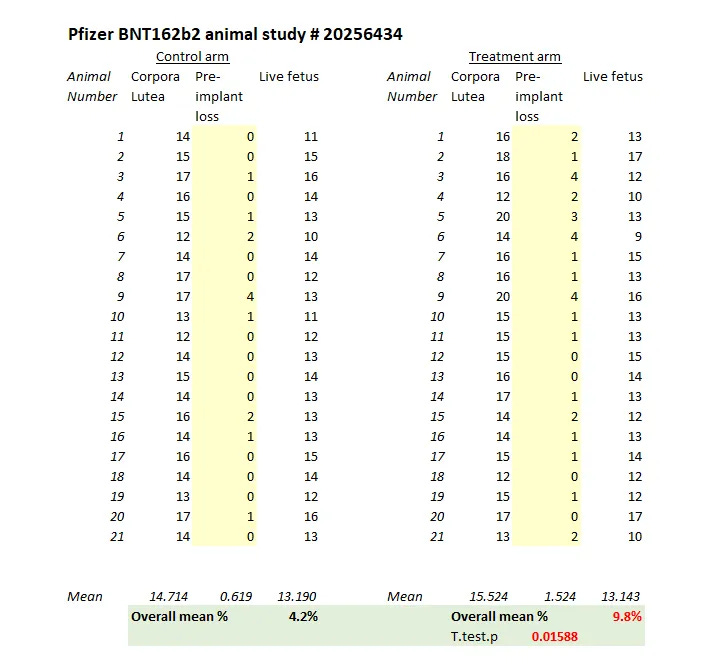
Here are the birth defects/abnormalities, both the fetal incidence and the litter incidence. Strangely enough there are 28 abnormalities are in the BNT162b2 litters, even though there were only 21 rats. Only 11 in the control. That’s an increase of 250% actually.
However, they say, we are not to compare the BNT162b2 to the control; no, we are to compare BNT162b2 to a distant song from a far off land called “historical control data range.”
Yes, BNT162b2 certainly was born with abnormalities.
Furthermore Ah Khan Syed graphed the data for miscarriages and it is pretty concerning; again it is more than double the rate for the control group.
Again they use the far off mystery data, the “historical control data range”, to justify to the TGA that double the miscarriage rate doesn’t matter.
Ah Khan Syed points out how abnormal this is too.
Note that there is another footnote included here with an (a) and directs the reader to look at historical data for comparison. It looks like the Dunnett test was using historical data as a comparator, but this is not the case - the semicolon separates the statements
It was in fact totally disingenuous to include any reference to historical controls in this table. If you perform a study, your control is your contemporary control (because that controls for the factors that are relevant to the study at the time - each arm being treated equally). The only time you use a historical control is if you are doing a single-arm observational study and don't have a comparator group.
It strikes me that their historical control data range might well be from all the rats in all the studies mentioned, including the other rats given poisonous concoctions like BNT162b2, and not just the control rats, as this could really make it much easier to pass things like this through the approval process.
And there was once a Jesuit document I read from the sixteenth century, a sort of moral instruction manual for spreading the Jesuit counter-reformation, that outlined what a lie is and what isn’t: in it the author said that if you said something to someone and you knew that they believed you were saying one thing, but in your own mind you were saying something different, even completely opposite, that it wasn’t a lie.
Well of course it’s a lie. And you know, looking at this, I think we have to assume the historical control data actually does include rats that were given other medications, as the footnotes don’t indicate otherwise, and usually these scientists are pretty careful to be carefully exact and rule out whatever nefarious assumption they can without actually lying (I guess it’s fraud otherwise and the risks they are willing to take for the company probably stop at the line of criminal culpability.)
Yes, this is so typical of those sorts of studies that have the stench of falsehood about them, justifying everything with a footnote that no one can verify.
Dr Ah Khan Syed also talks about the mysterious disappearing rat as well: this was rat number 22, who somehow imitates Schrödinger’s cat at an unknown point in the study, and disappears from the data.
I think rat 22 must have been one that had to be put down - the poor thing showed prominent lobular architecture of the liver (what the heck does this mean? The medical dictionary tells me that architecture of the liver is lobular) (I think it probably means the whole liver was highly inflamed), puke on the muzzle and irregular breathing, then raised hackles and a hunched body. And they must have banged the cage to wake it up and startled the poor thing, before they put it down, for it says, “hypersensitivity to noise stimulus”.
But what’s worse is that after that poor rat died, its sacrifice was in vain, for they still gave the 𝒇&*%^ thing to people.
And what’s even worse, to pregnant women.
Part 3 the VAERS data compared to the Influenza vaccine.
The clincher here is that Dr James Thorp compared the influenza vaccine to the Covid vaccine and found:
1200-Fold higher rate of Severe Menstrual Abnormalities
57-Fold higher rate of Miscarriage
38-Fold higher rate of Foetal Death / Stillbirth
15 other major pregnancy complications far exceeding the regulator’s safety threshold

Part 4. Miscarriages needed to treat.
If you want to be even more nauseated by all this, you can read Dr Ah Khan Syed’s article that works out how many miscarriages are needed to prevent one hospital visit for Covid.
The miscarriages needed to treat to prevent one hospitalisation is 5/0.18 (or 34712/(2527*0.5)) = 27.4
The miscarriages needed to treat to prevent one ICU admission is 5/0.01 (or 24712/(139*0.5)) = 500
Part 5. TGA DOCUMENT 6 Freedom of information release continued
Looking at the FOI TGA document 6, the Nonclinical Evaluation Report BNT162b2 [mRNA] COVID-19 vaccine (COMIRNATY™) Submission No: PM-2020-05461-1-2 Sponsor: Pfizer Australia Pty Ltd January 2021.
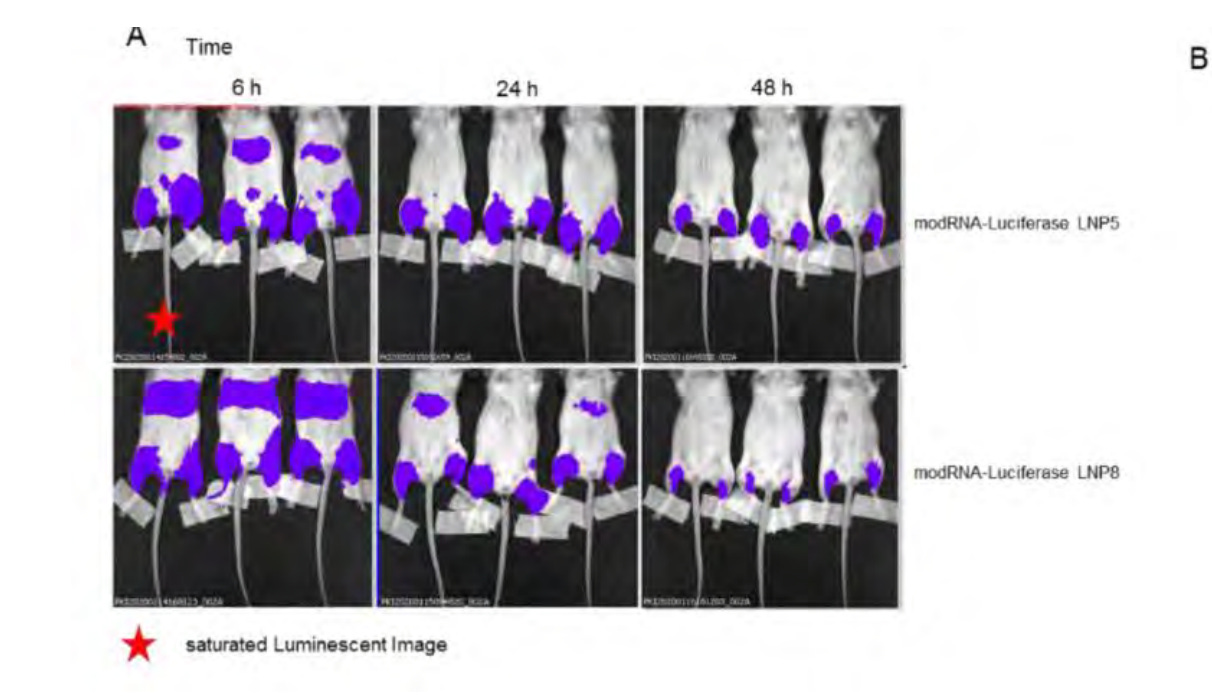
Forgive me if I’m wrong, but this doesn’t look like the luciferased mRNA stayed at the injection site and the liver in the poor old experimental rats.
What is not clear to me is what LNP-C12 or LNP 5 are but I think LNP 8 is the one they used, at least, from the fact that they keep mentioning it I think it is. (see page 10 paragraph 2)
Why isn’t this front page news on the Australian?
This is from a Clarendon College rat dissection manual - it shows the location of the heart and lungs - and it certainly looks to me as if the luciferased mRNA with the Liquid Nanoparticles is showing up around the heart and lungs like a freakin’ beacon in the first 6-24 hours. LNP 5 slightly less so, but it’s still going there.
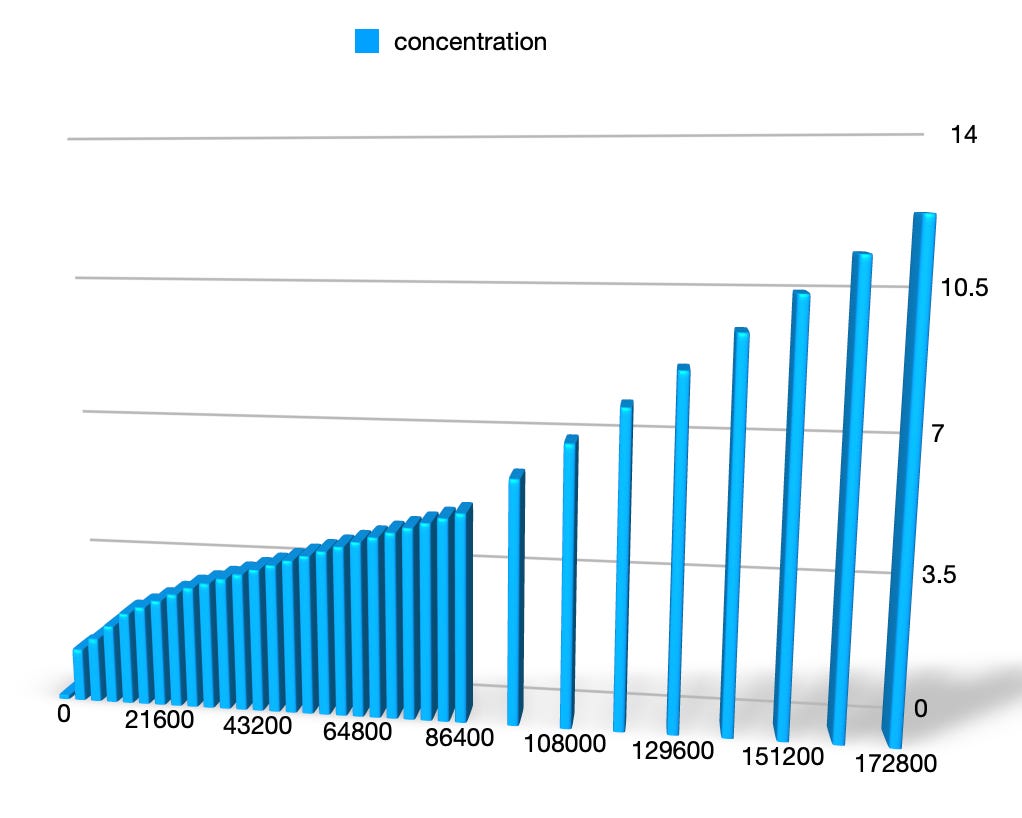
And there’s this - in the ovaries the concentration of LNP’s is actually increasing during the study period.
If you read their little summary at the bottom, what they call “lower total recovery” in the ovaries, could actually be more accurately characterised as “negative recovery rate” or in other words “concentration of lipids and mRNA is increasing at an ever increasing rate” - I interpolated a few values by averaging to get the graph and the x value on the plot below is seconds since injection and it really looks like the rate of increase is increasing between day 1 (86400) and day 2 (172800). Where will it be by day 60? Why is the rate increasing?
This is the concentration of mRNA in the Ovaries:
Addendum - let me make it perfectly clear - this is the data from the document on the basis of which the Australian Therapeutic Goods administration TGA approved the vaccines. Did the TGA ask Pfizer, what happens in the ovaries after two days? The LNP/mRNA concentration appears to be increasing exponentially - when does it stop increasing?
Somehow I think not; after all, it’s not “increasing exponentially” according to the real experts the scientists Pfizer paid to test their own product, it’s just “lower total recovery”. But it’s not.
What is happening to the Lipid Nanoparticle/mRNA?
I’ve taken the data from the chart above and made a chart, below, of the areas where the LNP concentration is increasing. As the concentration in the injection site decreases, the concentration in the spleen, ovaries, liver, and small intestine is increasing. The difference between them (red column) is decreasing.
It looks like the LNP is going from the injection site to the spleen, ovaries, liver, and to a lesser degree small intestine.
I guess that’s why they stopped measuring it at two days.
But don’t worry - nothing to see here - move along - we’re just seeing “lower total recovery”.
Part 7 - Igor Chudov notices that Moderna miscarriage rates are 42% higher.
Last year, Igor Chudov revealed a very peculiar oddity in the CDC’s recently released Miscarriage statistics from the V-Safe data on Pfizer, Moderna and Johnson and Johnson Covid vaccines in pregnancy.
On October 19th 2022 CDC’s Lauren Zauche made a presentation to ACIP the CDC committee on vaccine safety that included this power point (archived).
Slide number 32 contains this chart showing self-reported rates of miscarriage, still birth, abortions and ectopic pregnancies:
The rates of miscarriage are circled. What Igor Chudov noticed is that the rate of miscarriage is 4.7% for Moderna recipients and 3.3% for Pfizer recipients. What is rather odd about these statistics is that the rate is so much higher for the Moderna Vaccine recipients. The number of participants in the study means that these figures should be very robust. The difference between 4.7% and 3.3% might not sound that huge - but with an N value of 8,366 and 12,751 respectively, these should be very robust statistics, and 4.7% / 3.3% = 1.42.
A 42% difference.
Why should there be a 42% difference between the rates of miscarriage of these two vaccines?
One difference is that Moderna has a higher dosage - the Pfizer dosage is 30 mcg but the Moderna dose is 100 mcg, with 50 mcg for booster.
That could well imply that the rates of miscarriage are higher with a higher dose, which itself seems to imply… the vaccines cause miscarriages.
These statistics are very odd, and look wrong.
But the other very, very odd thing about these statistics is that the normal rate of miscarriage for 0-20 weeks is apparently around 5.97% (sum of percentages in this article / 120 days )
What’s happening here? Are the vaccines somehow causing less miscarriages to occur? That’s incredible, and completely unbelievable.
For over a year, Arkmedic has been pushing for them to release the V-Safe data.
A year ago Arkmedic pointed out that the CDC:
never actually reported on final miscarriage rates and the data that they had released showed in increase in the rate you would expect (contrary to their claim)
Then three days after Arkmedic wrote an article calling for the CDC to release the V-Safe data on the safety of the vaccines in pregnancy, the presentation by Lauren Zauche et al was made to the CDC with an update of the V-safe pregnancy data.
But what Arkmedic’s most recent article (at the time of writing of this post) on October 21st seems to imply is that there is either incompetence or outright dishonesty in the CDC’s statistics.
Arkmedic goes on to look at the rate of birth defects.
The rate of major birth defects for mRNA vaccines given in the first trimester was 3.7% with confidence limits up to 4.3% - way over the background rates of major birth defects.
The data when presented should be very clear and should speak for itself, if people are trust that the CDC is correct in their extremely dubious assessment that the vaccines are safe in pregnancy.
But instead, the data is confusing and self-contradictory.
Arkmedic summarises:
The data presented to the CDC this week should have been released to the public a year ago. If they were, we would have done the work that Zauche and Shimabukuro should have done. It’s possible that millions of miscarriages would have been prevented.
For now, they have merely attained the infamy of appearing in the Welcome to Gilead meme series.
For the future, I would hope that a much more in depth investigation of exactly why they withheld and misrepresented this data will take place.
Disclaimer: this article is not medical advice - go and see a Doctor who takes the Hippocratic Oath seriously to get medical advice. This article is not to be taken as reflecting the opinions of Submarine Media Pty Ltd.


