
Fact check: Victorian Data shows jabs were harming kids.
Fact check: Victorian Data shows jabs were harming kids.
Alarming.

All of this data apparently comes from an FOI release from the Victorian State Government in Australia.
The Nobody Who Knows Everybody wrote about it, and possibly was the person who requested the FOI. All the data is available on his website and including the helpful charts.
Can’t verify yet
At this point I must add, that I have been unable to verify this data. I believe it is genuine - but cannot find anything about this FOI request on the Victorian government website.
Link to the article
His/her article is well worth reading:
This chart is from information released by FOI from the Victorian State Government, in Australia. The yellow line is the cumulative number of jabs. The blue line is the jabs per month, and what we see here is clear evidence of causation: the administration of the jab precedes the sharp rise in number of cardiac presentations in the public hospitals for age group 10-19.
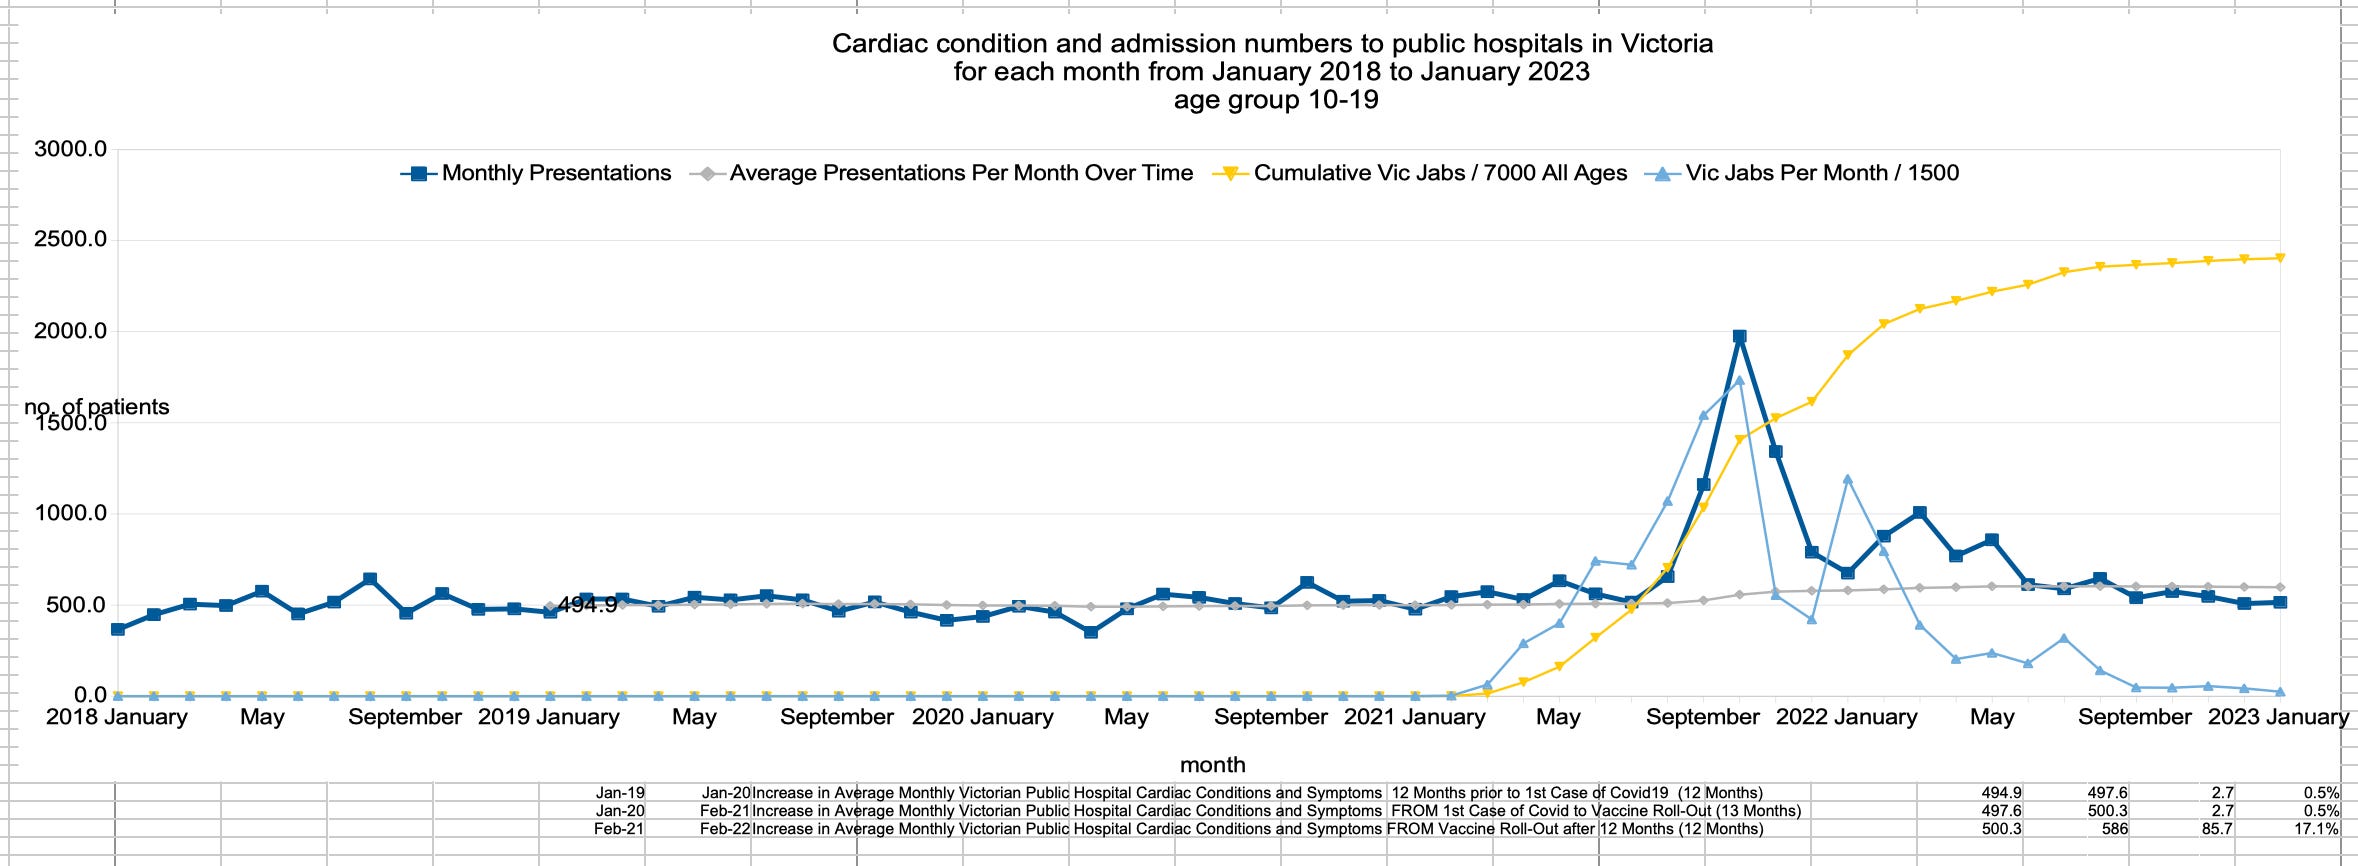
A similar effect is visible in the 20-29 age group.

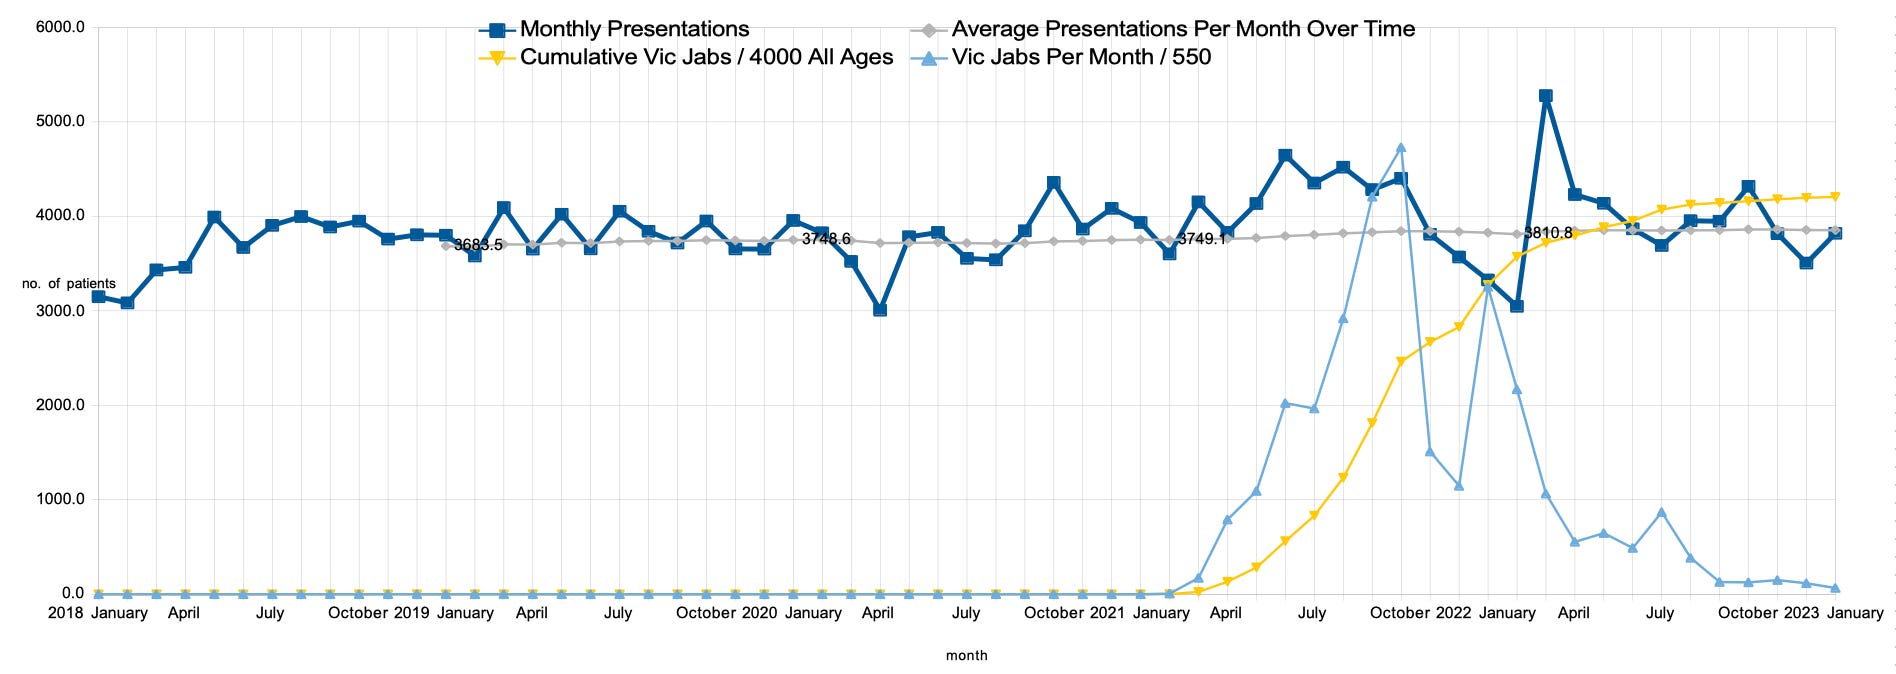
30-39

A lesser effect but it’s still visible in 40-49

50-59 a slight effect
There doesn’t seem to be much effect for 60-80+.
However there is another great chart.
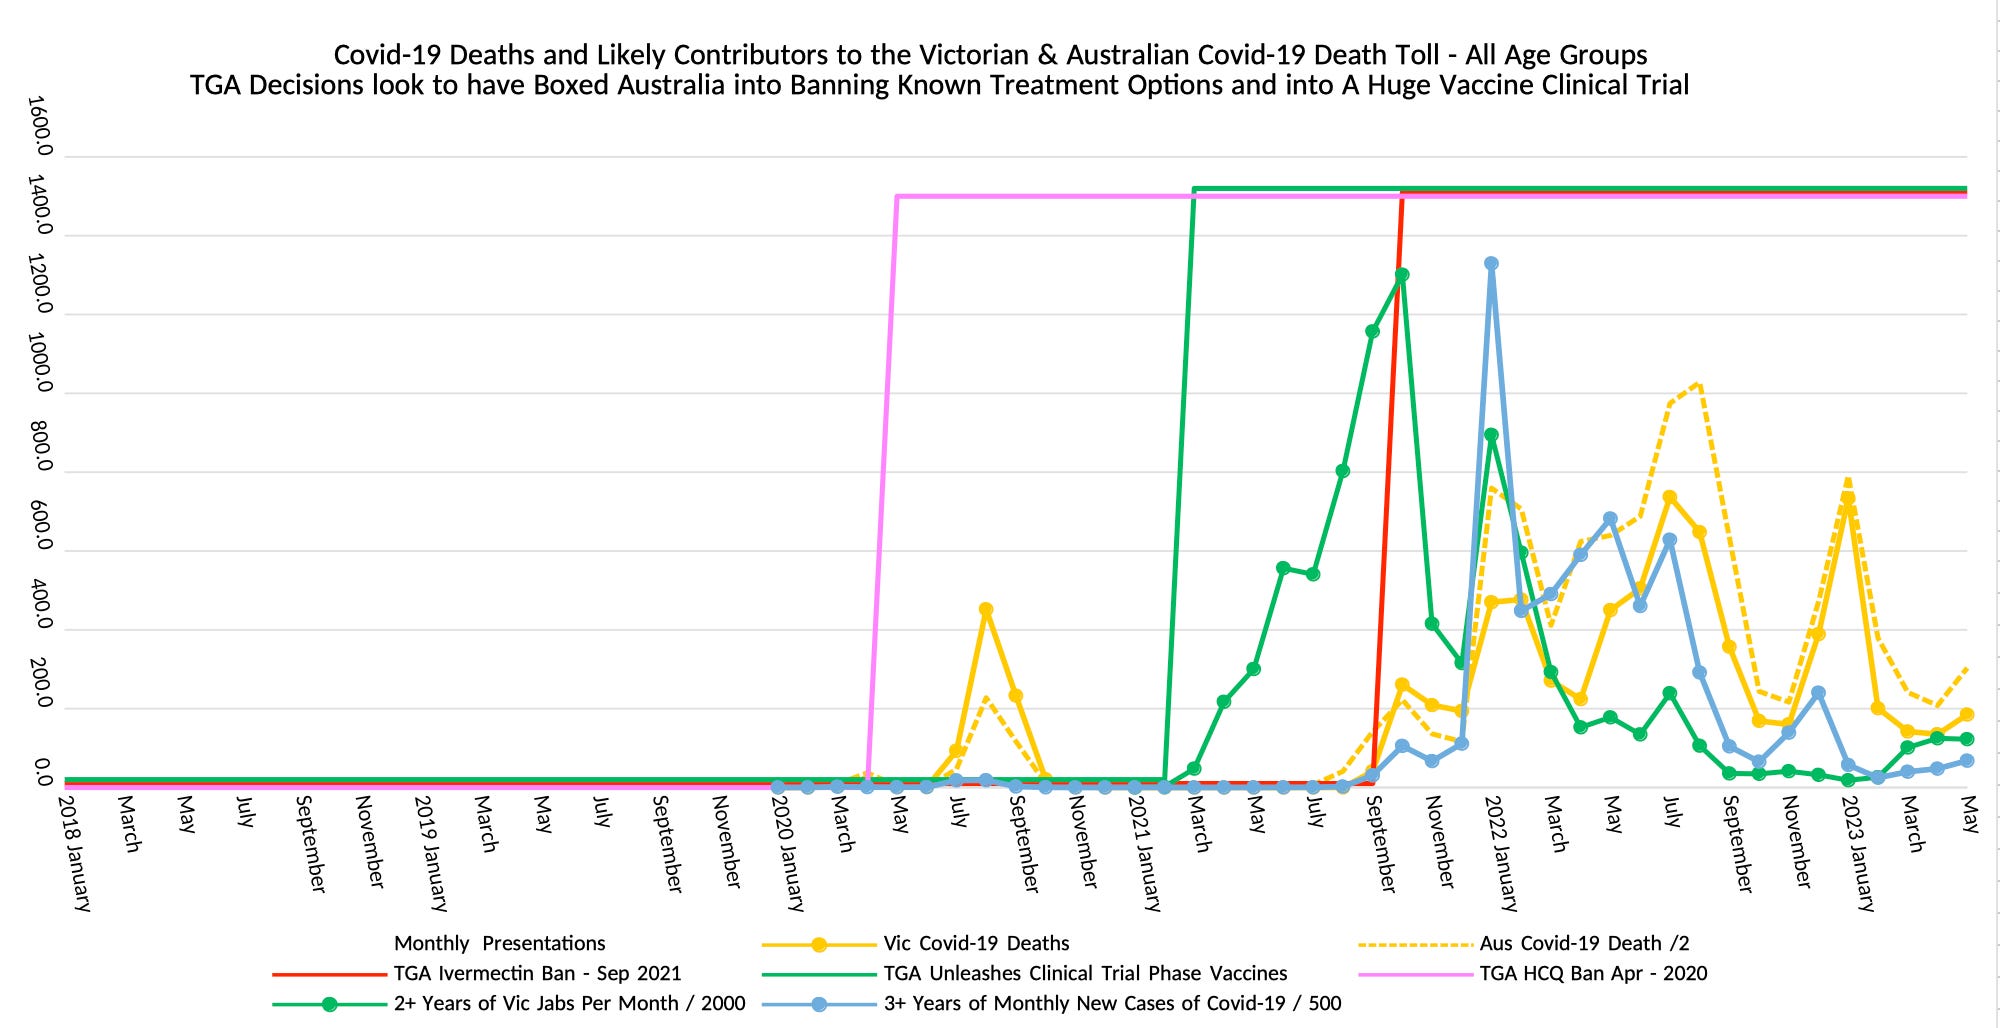
This demonstrates that Covid deaths in Australia went up after the TGA ban on Doctors prescribing Hydroxychloroquine to Australian patients, and that the deaths went up further after the experimental vaccines were authorised and Ivermectin was banned.
Israeli study
By the way, this data is credible as it tells the same story as the Israeli emergency response data that showed an increase in cardiovascular events, statistically associated with the Covid vaccine rollouts in Israel.
Can’t verify at this stage
Nonetheless I can’t verify the FOI as strangely enough it’s not listed on the Victorian government page that lists FOI requests that were granted in 2023: